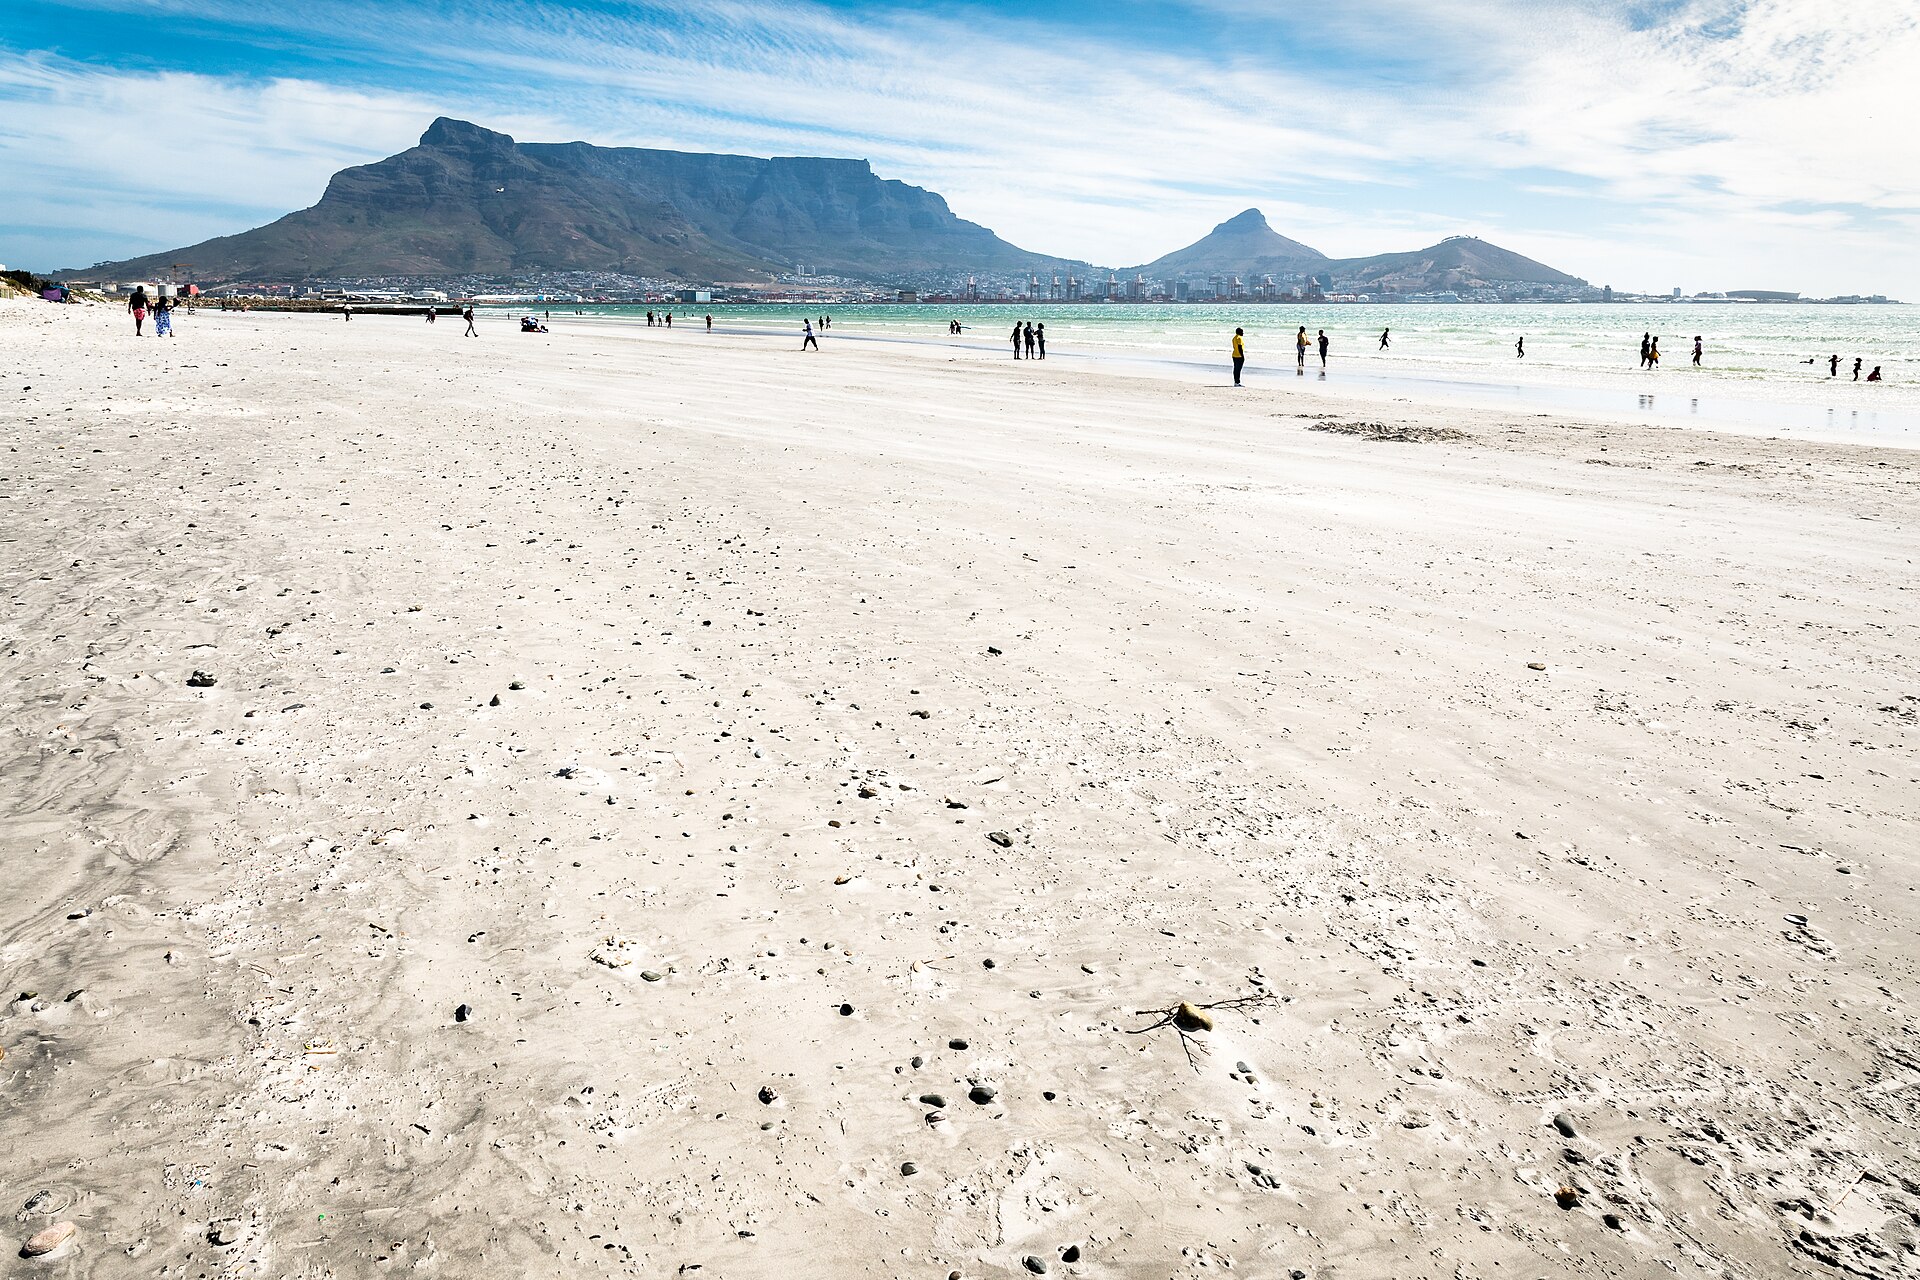
Mid-July in Blouberg is the quietest the beach gets. The southeaster has packed up for winter, the frontal systems roll through from the northwest, and on a flat grey morning you can walk from Dolphin Beach to Kite Beach without seeing a single kite in the sky. Yet this is precisely the moment the questions start arriving from Germany, the Netherlands, Brazil and the UK, because July is when travelling kiters book their Cape Town summer. And the question is always some version of the same thing: if I come for two weeks, how many days will I actually ride?
Vague answers annoy us as much as they annoy you. “It’s windy in summer” is not a number. So we sat down with the long-term wind records for the Table View / Bloubergstrand weather station, as published across the international wind-statistics and spot databases, and turned the percentages into something you can plan a trip around: kiteable days per month.
First, what counts as a kiteable day
The honest starting point is the definition. The standard measure used in wind statistics counts a “windy day” as one with at least 4 Beaufort (roughly 11-16 knots) blowing for three or more consecutive daylight hours. That is a deliberately conservative bar. It is enough to ride a big kite or a foil, but it is not the nuking 25-knot southeaster of the postcards.
Two things follow from that. In summer, the definition undersells the experience: when the Cape Doctor is on, it rarely idles at 12 knots. Guides who work this stretch describe the typical in-season day as starting light around mid-morning and building steadily until late afternoon, with working days commonly in the 20-40 knot band. If a summer day clears the 4 Beaufort bar at all, it usually clears it with room to spare. In winter, the opposite caution applies: a July day can be statistically “windy” thanks to a pre-frontal northwester that arrives with rain and a lumpy sea. Kiteable, technically. The trip of your dreams, not exactly. Keep both halves of that in mind as you read the table.
The month-by-month count
The percentages below are the long-term wind probability for the Bloubergstrand area by month. We converted each into an approximate number of days, rounded to the nearest whole day.
| Month | Wind probability | Kiteable days (approx.) | What the wind is doing |
|---|---|---|---|
| January | 83% | 26 | Peak southeaster, the most reliable month of the year |
| February | 77% | 22 | Still full season, marginally fewer blown-out days |
| March | 61% | 19 | Season winding down, often gentler and less crowded |
| April | 50% | 15 | Transition month, a coin flip on any given day |
| May | 43% | 13 | The low point, first winter fronts arrive |
| June | 48% | 14 | Frontal northwesters, cold and shifty |
| July | 47% | 15 | Midwinter, wind comes with weather attached |
| August | 52% | 16 | Fronts still passing, first hints of the southeaster |
| September | 57% | 17 | Spring switch-on, the Cape Doctor starts testing the water |
| October | 65% | 20 | Shoulder season proper, summer pattern establishing |
| November | 79% | 24 | Southeaster near full strength, famously active month |
| December | 82% | 25 | High season, strong and consistent |
Add it up and Blouberg logs roughly 226 kiteable days a year. For context, that is a wind spot delivering rideable conditions on about six days in ten, every month of the year averaged, on a definition that ignores how strong the good days actually get.
What the numbers say about summer
The core season the table reveals runs November to February, with each of those months delivering between 22 and 26 kiteable days. That squares with what the guidebooks report anecdotally: around five windy days a week in season. It also explains why the world’s professional big-air riders base themselves here every Southern Hemisphere summer. There are windier single days elsewhere on the planet; there are very few places that stack this many of them back to back, with a sea breeze machine as predictable as the Cape Doctor.
Note what the numbers do not say. Even January, the best month, sits at 83%, not 100%. A two-week peak-season trip should expect two or three flat days, and honest local operators say as much, quoting a 60-70% wind chance across the broader season rather than promising wind every day. Cape Town rewards the kiter who books enough days for the average to work in their favour, and who treats the calm days as Table Mountain and wine-farm days rather than losses.
The winter asterisk
The most surprising row in the table is the one we are living through as this is published: July, at 47%, on paper nearly half the month. That figure is real, but it needs the biggest asterisk of the year. Winter wind here is frontal, arriving from the northwest ahead of cold systems, often with rain, and it favours different corners of the coastline than the summer southeaster does. The direction a spot needs matters as much as the speed, which is why we mapped exactly that in our guide to which wind direction works at which Blouberg spot. A dedicated local with a wetsuit hood and a flexible diary can absolutely ride through winter. A visitor who lands in July expecting Kite Beach in season will mostly find surfers and dog walkers.
There is also the small matter of the water. The Atlantic here is cold in every month, and the summer southeaster actually drives upwelling that makes December water colder than you would guess. If sea temperature will make or break your trip, read our month-by-month breakdown of Blouberg’s sea temperature before you pack a shorty.
How to size a trip with this table
The arithmetic is straightforward once you have the monthly count. A 14-day trip in December or January should yield roughly 11-12 rideable days; the same fortnight in March, about 8-9; in October, around 9. If your priority is maximum days on the water, aim for the December-January core. If you would trade a couple of windy days for emptier beaches and easier parking, March and October are genuinely underrated, and several visiting kiters we have spoken to rate November above the December rush for exactly this reason.
Build the daily rhythm into your plans too. The southeaster typically sleeps in, arriving late morning and peaking towards 16:00. That means mornings are for coffee, downwinder logistics or a surf, and it means a forecast that looks marginal at 09:00 often becomes a solid session by mid-afternoon. Beachfront numbers also tend to run a few knots above what the forecast models show when the southeaster is working, a quirk regular visitors learn quickly.
The fine print that percentages hide
Long-term statistics smooth out the thing kiters feel most: streaks. Cape Town wind arrives in runs, several days on, a couple off, rather than politely alternating. A 77% February can still contain a four-day glassy spell, and a 61% March can throw a ten-day streak of perfection. That is not the statistics being wrong; it is what an average looks like from inside a single fortnight. The table tells you what to expect across a season, not what next Tuesday holds.
For next Tuesday, you want live data, not climatology, and once you are here the habit worth learning is checking actual readings before you drive to the beach. Here is how to read the live Blouberg wind numbers like a local, including why the direction arrow matters more than the big number. Between now and November the table above is your planning tool. From the first proper southeaster of spring, the only count that matters is today’s.
Sources & further reading
- thekitespot.com – Kitesurf in Cape Town (Bloubergstrand) spot guide
- Windfinder – Wind and weather statistics, Table View / Bloubergstrand
- IKSURFMAG – Cape Town kitesurfing travel guide
- Wake Up Stoked – Kitesurf Cape Town spot guide
- Cape Town Magazine – The Cape Doctor: Cape Town’s south-easter
- Surf-forecast.com – Bloubergstrand wind statistics
Featured image: Bloubergstrand, South Africa8.jpg by dconvertini, via Wikimedia Commons (taken on location) — CC BY-SA 2.0
